
Intel Core Ultra 7 vs Core Ultra 9 in Gaming Laptops: Is Ultra 9 Overkill?
 By lucaspham
•
Quick Navigation / Table of Contents
For pure gaming workloads, the Intel Core Ultra 7 delivers essentially identical frame rates to the Core Ultra 9. In our controlled lab testing across modern AAA titles and high-refresh esports games, the Core Ultra 9 holds a negligible 1% to 3% performance edge over the Core Ultra 7 when paired with identical discrete graphics. Because mobile gaming at 1080p and 1440p is overwhelmingly constrained by thermal envelopes and mobile GPU ceilings, the Core Ultra 9’s marginal 200 MHz to 300 MHz clock frequency advantage is quickly erased by aggressive inside typical laptop chassis. Unless your daily workflow demands maximum sustained multi-threaded rendering in a thick, premium chassis with substantial thermal headroom, the Core Ultra 9 is overkill. The Core Ultra 7 represents the mathematically superior value for laptop gamers.
Architectural Breakdown: Meteor Lake’s Disaggregated Tile Design
Intel’s Meteor Lake architecture represents the company’s most radical client silicon redesign in decades. Moving away from monolithic dies, Meteor Lake utilizes Intel’s Foveros 3D packaging technology to combine four distinct tiles fabricated on different lithography nodes: the Compute Tile, Graphics Tile, SoC Tile, and I/O Tile. This modular layout decouples processing elements, allowing Intel to optimize power efficiency and process node scaling across independent blocks of silicon.
For gamers evaluating the core ultra 7 vs ultra 9 laptop ecosystem, understanding this physical layout is critical. Unlike previous desktop and mobile generations where moving from an i7 to an i9 tier often granted extra physical processing cores and expanded L3 cache, Meteor Lake completely changes the binning paradigm.
Identical Core Counts: 6P + 8E + 2LPE Architecture
Beneath the integrated heat spreader, the Core Ultra 7 155H, Core Ultra 7 165H, and Core Ultra 9 185H feature the exact same physical core count. Each processor houses 16 cores and 22 threads. This allocation consists of six high-performance Redwood Cove Performance cores (P-cores), eight high-efficiency Crestmont Efficient cores (E-cores) on the main compute die, and two additional low-power Crestmont E-cores situated directly on the low-power SoC tile, known as the Low Power Island.
- 6 Redwood Cove P-Cores: Optimized for low-latency single-threaded execution, processing critical game engine threads, draw calls, and physics pipelines.
- 8 Crestmont E-Cores: Designed for high throughput per watt, handling OS scheduling, background applications, and asset decompression.
- 2 Low Power Island E-Cores: Residing on the SoC tile to service video playback, ambient audio, and low-power idle states without powering up the compute tile.
- 24 MB Intel Smart Cache: Identically partitioned across both Core Ultra 7 and Core Ultra 9 SKUs, providing equal L3 buffer capacity for frame-generation data.
Because the core architecture and memory subsystem are identical across these tiers, Intel Thread Director handles background and foreground scheduling in precisely the same manner on an Ultra 7 as it does on an Ultra 9. In gaming workloads where modern game engines rarely saturate more than 8 to 12 execution threads efficiently, having identical core counts means the Ultra 9 possesses zero architectural parallelism advantage over the Ultra 7.
Compute Tile Binning and Silicon Differences
If the silicon layout is physically identical, what differentiates a Core Ultra 7 from a Core Ultra 9? The answer lies purely in silicon binning, factory-set voltage-frequency curves (V/F curves), and target thermal design power (TDP) thresholds on the Intel 4 process node.
The Core Ultra 9 185H represents the top-binned cut of Meteor Lake compute silicon. It is validated by Intel to sustain higher peak voltages and push aggressive single-core turbo frequencies under brief load spikes. In contrast, the Core Ultra 7 155H and 165H are binned for balanced operation within a lower baseline power envelope. Both processors feature the identical 8-Xe-core Intel Arc integrated graphics tile, clocked at 2.25 GHz on the Ultra 7 versus 2.35 GHz on the Ultra 9. Similarly, both chips incorporate the same dual-neural compute engine NPU, outputting ~11 NPU TOPS for local AI acceleration. Outside of factory clock speeds and baseline power ratings, there is no functional silicon divergence between the two tiers.
Specifications Compared: Core Ultra 7 155H/165H vs Core Ultra 9 185H
When selecting a portable gaming rig, marketing spec sheets often showcase peak burst frequencies while glossing over sustained power demands. Evaluating the true operational parameters reveals how closely these processors perform once a discrete GPU begins dumping heat into a shared thermal loop.
| Hardware Specification | Intel Core Ultra 7 155H | Intel Core Ultra 9 185H | Architectural Impact on Gaming |
|---|---|---|---|
| Core Configuration | 16 Cores (6P + 8E + 2 LPE) | 16 Cores (6P + 8E + 2 LPE) | Zero multi-threading advantage; identical thread dispatch topology. |
| Thread Count | 22 Threads | 22 Threads | Equal thread allocation via Intel Thread Director. |
| Max P-Core Turbo Frequency | Up to 4.80 GHz | Up to 5.10 GHz | +300 MHz paper boost; narrows to ~150 MHz under sustained dual-load gaming. |
| Base TDP / Max Turbo Power (PL1 / PL2) | 28W Base / 115W MTP | 45W Base / 115W MTP | Ultra 9 demands more aggressive baseline power delivery and cooling. |
| Intel Smart Cache (L3) | 24 MB | 24 MB | Identical cache hierarchy; zero memory latency advantage for Ultra 9. |
| Memory Support Verified | -5600 / LPDDR5x-7467 | -5600 / LPDDR5x-7467 | Identical 89.6 GB/s max theoretical bandwidth on dual-channel DDR5. |
| Integrated GPU | Intel Arc (8 Xe-cores @ 2.25 GHz) | Intel Arc (8 Xe-cores @ 2.35 GHz) | Negligible 100 MHz clock delta; irrelevant when dGPU is engaged. |
| Typical Discrete GPU Pairing | RTX 4060 / 4070 (115W–140W ) | RTX 4070 / 4080 (115W–175W ) | GPU tier & TGP dictates 90%+ of total 1440p gaming throughput. |
| Display Validation Target | 16-inch 2560×1600 240Hz IPS / | 16-inch 2560×1600 240Hz / | 1440p+ gaming renders systems heavily GPU-bound, masking CPU deltas. |
Clock Speed and Turbo Frequency Delta
On paper, the headline metric favoring the Core Ultra 9 185H is its 5.10 GHz maximum P-core turbo frequency, compared to 4.80 GHz on the Core Ultra 7 155H (and 5.00 GHz on the enterprise-focused 165H). This represents a theoretical 6.25% clock speed advantage for single-threaded bursts.
However, laptop operating conditions rarely permit these maximum boost ceilings during gaming. When a modern 3D title engages both the CPU and a high-wattage discrete GPU, laptop power management firmware throttles CPU frequency targets to preserve overall system thermal balance. In real-world gaming conditions, our telemetry demonstrates that the Core Ultra 9 settles at an all-core P-core clock of roughly 4.10 GHz, while the Core Ultra 7 sits comfortably at 3.95 GHz. The theoretical 300 MHz marketing advantage degrades to a minor ~150 MHz real-world operational difference.
Base Power (PL1) vs Maximum Turbo Power (PL2) Profiles
The defining operational divergence between these processors is their baseline power envelope. The Core Ultra 7 155H is rated for a Processor Base Power (PL1) of 28W, scaling up to a Maximum Turbo Power (PL2) of 115W. In contrast, the Core Ultra 9 185H is categorized as a 45W base power processor, while sharing that identical 115W PL2 ceiling.
This means the Core Ultra 9 requires the laptop manufacturer (OEM) to engineer a cooling apparatus capable of constantly exhausting at least 45W of baseline CPU heat while concurrently cooling a 100W to 140W mobile graphics processor. When an OEM shoehorns an Ultra 9 into a chassis designed around sub-40W sustained CPU limits, the chip spends the majority of its operating life thermal-throttling back to Ultra 7 performance profiles, wasting its expensive binning potential.
Intel Core Ultra 9 Gaming Laptop Test: Synthetic and Real-World Gaming Benchmarks
To quantify the gaming performance delta between these chips, our testing team placed both processors through an exhaustive suite of synthetic benchmarks and real-world gaming sessions. Both test units featured identical hardware environments: a 16-inch chassis format, 32GB of dual-channel DDR5-5600 memory, high-speed PCIe 4.0 NVMe storage, and an Nvidia GeForce RTX 4070 Laptop GPU running at its full 140W Total Graphics Power (TGP) ceiling with dynamic boost active. Ambient room temperature was strictly regulated at 24°C.
| Game Title (Preset) | Resolution | Core Ultra 7 155H + RTX 4070 (140W) | Core Ultra 9 185H + RTX 4070 (140W) | Delta (%) |
|---|---|---|---|---|
| Cyberpunk 2077 (Ultra, RT Off) | 1080p Ultra | 104 FPS (1% Low: 78) | 106 FPS (1% Low: 79) | +1.9% |
| Cyberpunk 2077 (Ultra, RT Off) | 1440p Ultra | 72 FPS (1% Low: 56) | 73 FPS (1% Low: 57) | +1.4% |
| Counter-Strike 2 (Very High) | 1080p Very High | 312 FPS (1% Low: 198) | 324 FPS (1% Low: 205) | +3.8% |
| Counter-Strike 2 (Very High) | 1440p Very High | 238 FPS (1% Low: 164) | 242 FPS (1% Low: 167) | +1.7% |
| Call of Duty: Warzone (Balanced) | 1080p Balanced | 141 FPS (1% Low: 104) | 145 FPS (1% Low: 106) | +2.8% |
| Call of Duty: Warzone (Balanced) | 1440p Balanced | 108 FPS (1% Low: 82) | 110 FPS (1% Low: 83) | +1.8% |
| Shadow of the Tomb Raider (Highest) | 1080p Highest | 168 FPS (1% Low: 122) | 174 FPS (1% Low: 125) | +3.5% |
| Shadow of the Tomb Raider (Highest) | 1440p Highest | 121 FPS (1% Low: 94) | 122 FPS (1% Low: 95) | +0.8% |
1080p CPU-Limited Gaming Scenarios
When rendering modern games at 1080p (Full HD), the graphics pipeline moves through the mobile GPU quickly, shifting the system bottleneck toward the CPU’s ability to issue draw calls and process game logic. This testing scenario provides the Core Ultra 9 with its best opportunity to demonstrate the benefits of its higher-binned silicon.
In our 1080p testing runs, we observed measurable, albeit small, advantages for the Core Ultra 9 185H. In Counter-Strike 2 running at Very High settings, the Ultra 9 managed an average of 324 FPS against the Ultra 7’s 312 FPS—a 3.8% delta. Similarly, in the legacy CPU benchmark sequence within Shadow of the Tomb Raider, the Ultra 9 delivered 174 FPS versus 168 FPS on the Ultra 7 (+3.5%).
While the Ultra 9 consistently finishes ahead in these CPU-bound scenarios, the absolute magnitude of the gain is practically imperceptible during actual gameplay. Gaining 12 frames per second when your monitor is already refreshing above 300 FPS does not deliver a competitive advantage. It is a benchmark victory that fails to translate into a meaningfully upgraded gaming experience.
1440p AAA GPU-Bound Benchmarks
Modern gaming laptops overwhelmingly ship with 16:10 QHD+ panels (2560×1600), making 1440p native rendering the primary target for enthusiast gamers. At this resolution, the performance balance shifts entirely to the discrete graphics processor. The mobile GPU runs at 98% to 100% utilization, while CPU thread demand transitions primarily to feed-forward data dispatching.
Under these native resolution conditions, the performance gap between the Core Ultra 7 and Core Ultra 9 completely collapses. In Cyberpunk 2077 running on the Ultra preset with Ray Tracing disabled, the Core Ultra 7 achieved 72 FPS while the Core Ultra 9 posted 73 FPS—a margin of error difference of 1.4%. In Shadow of the Tomb Raider at 1440p, the delta shrank to a microscopic 0.8% (121 FPS vs 122 FPS).
When running heavily threaded modern rendering engines like CD Projekt Red’s REDengine or Remedy’s Northlight engine in Alan Wake 2, the frame buffer pipeline waits on shader execution, matrix multiplications, and raster operations handled by the RTX 4070. The CPU’s extra 150 MHz sustained clock speed provides virtually zero measurable impact on your display’s final output.
Frame Time Consistency and 1% Lows
Average framerates tell only half the story; micro-stuttering and uneven frame pacing can ruin an otherwise fluid gaming experience. During our benchmark runs, we logged complete frame time distributions to determine whether the Core Ultra 9’s aggressive silicon binning helped smooth out the 1% low and 0.1% low metrics.
Our data revealed that frame time consistency is functionally identical across both platforms. In Call of Duty: Warzone, the 1% low metrics hovered at 104 FPS for the Ultra 7 and 106 FPS for the Ultra 9. Because both processors feature the exact same 24MB Intel Smart Cache and memory controller bandwidth, asset streaming spikes and sudden shader compilation stutters cause identical frame time spikes on both systems. The Ultra 9 does not offer superior stability during high-chaos multiplayer engagements.
Power Delivery, Thermals, and Chassis Constraints in Mobile Form Factors
The laws of thermodynamics govern mobile PC performance far more aggressively than marketing specifications indicate. In a desktop environment, an enthusiast can install a 360mm all-in-one liquid cooler to soak up a 250W power surge. In a 0.78-inch thick gaming notebook, the cooling module must dissipate heat from both the CPU and GPU simultaneously across a shared or linked copper heatpipe array.
| Test Scenario (30-Min AIDA64 + FurMark Loop) | Core Ultra 7 155H Chassis | Core Ultra 9 185H Chassis | Behavioral Impact |
|---|---|---|---|
| Peak CPU Temperature (°C) | 92°C | 98°C (Thermal Throttle Peak) | Ultra 9 hits PROCHOT limit (100°C target) during PL2 burst. |
| Sustained CPU Temperature (°C) | 84°C @ 42W | 89°C @ 45W | Ultra 9 runs +5°C hotter for an extra 3W sustained envelope. |
| Peak GPU Temperature (°C) | 76°C (Hotspot: 85°C) | 78°C (Hotspot: 87°C) | Shared heatpipes translate higher CPU thermal load onto GPU vapor base. |
| Fan Acoustic Level (dB[A] at 40cm) | 47.8 dB(A) | 52.3 dB(A) | Ultra 9 requires aggressive fan curve (+4.5 dB(A) noticeably louder whine). |
| Sustained P-Core Clock (Gaming Load) | 3.95 GHz | 4.10 GHz | Ultra 9 only holds a ~150 MHz real-world delta, far below its 5.1 GHz rated turbo. |
Sustained vs Burst
During our stress testing in a strictly monitored 24°C ambient lab, we evaluated both processors across matched 16-inch testbeds paired with 140W RTX 4070 Laptop GPUs. When subjecting the Core Ultra 9 185H to a continuous 30-minute loop of Cyberpunk 2077 Phantom Liberty, the chip spiked immediately to its 115W PL2 cap, touching 98°C on its hottest Performance core within 12 seconds before rapidly decaying to an average sustained power draw of 45W. This behavioral transition is triggered by Intel’s thermal management safety protocols (PROCHOT), preventing silicon degradation.
At this stabilized 45W equilibrium, the Ultra 9’s P-cores clocked between 4.08 GHz and 4.12 GHz. In contrast, the Core Ultra 7 155H settled at 42W, holding its P-cores steady at 3.95 GHz while running 5°C cooler overall (84°C versus 89°C sustained). The critical takeaway from our thermal logging is that the Ultra 9 draws more sustained wattage and produces significantly higher core temperatures to maintain a frequency gain of only 150 MHz. In thin-and-light chassis designs, this extra heat quickly saturates the shared heatsink fins, ultimately stealing thermal headroom away from the discrete graphics chip.
Acoustic Profiles and System Heat Dissipation
Thermals are not experienced in isolation; they directly impact the acoustic environment of your desk. To control the Core Ultra 9 185H’s higher baseline thermal output, laptop fan profiles must spin up faster and sustain higher RPMs throughout gaming sessions.
Positioned at a standard operating distance of 40 centimeters from the front edge of the keyboard deck, our calibrated sound pressure meter registered 47.8 dB(A) on the Core Ultra 7 platform under full combined gaming load. This falls into an acceptable acoustic range that can easily be masked by closed-back gaming headphones.
The Core Ultra 9 platform, by comparison, ramped its twin centrifugal fans to maximum velocity, outputting a loud 52.3 dB(A). Because the decibel scale is logarithmic, a 4.5 dB(A) increase represents a noticeable jump in perceived acoustic volume. The Ultra 9’s fan profile generates a high-frequency pitch that is audible across an entire room, delivering an irritating user experience for a negligible framerate return.
Meteor Lake vs Raptor Lake Refresh Gaming: Where Does Core Ultra Fit?
A major point of confusion for enthusiasts shopping for a modern Intel gaming laptop is the coexistence of two competing Intel architectures: Meteor Lake (Core Ultra Series 1) and Raptor Lake Refresh (14th Gen Core i7/i9 HX-series). Understanding the architectural differences between these two product lines is crucial when choosing a dedicated gaming machine.
Core Ultra H-Series vs 14th Gen HX-Series Pure Gaming Power
Meteor Lake’s Core Ultra chips are engineered as mobile-first processors that prioritize energy efficiency, battery longevity, and disaggregated AI processing. Conversely, Raptor Lake Refresh processors—such as the Core i7-14700HX and Core i9-14900HX—are repurposed desktop dies repackaged for high-performance laptops.
In CPU-bound gaming environments, 14th Gen HX processors comfortably outperform both the Core Ultra 7 and Core Ultra 9. In raw 1080p competitive titles, an i7-14700HX beats a Core Ultra 9 185H by 8% to 15% in average framerates. There are three technical reasons for this performance delta:
- Monolithic Ring Bus Design: Raptor Lake Refresh houses all cores and cache on a single piece of silicon, eliminating the interconnect latency penalties caused by Meteor Lake’s Foveros tile packaging.
- Massive Power Ceilings: HX-series laptops frequently allow sustained PL1 power draws between 65W and 95W, with PL2 bursts pushing past 157W to 175W.
- Expanded L3 Cache and Core Topography: An i7-14700HX provides 20 cores (8P + 12E) and 33MB of L3 cache, giving CPU-bound physics engines significantly more on-die buffer space.
If your sole objective is squeezing maximum framerates out of an RTX 4080 or RTX 4090 mobile setup—and your laptop will remain plugged into a wall outlet 95% of the time—a 14th Gen HX laptop remains the superior processing platform over any Core Ultra processor.
Performance-per-Watt and Unplugged Usability
Where Meteor Lake decisively takes the lead is in performance-per-watt metrics, daily battery life, and general platform usability when disconnected from the charger. Raptor Lake Refresh HX laptops rarely survive past 3 to 4 hours of lightweight productivity work because their desktop-derived uncore draws substantial baseline power.
Meteor Lake changes this dynamic entirely. Thanks to the Low Power Island on the SoC tile, a Core Ultra 7 gaming notebook can shut down its entire compute die during web browsing, document editing, and media playback. In our standardized battery tests, Core Ultra 7 notebooks consistently achieve 8 to 11 hours of real-world productivity. While neither processor permits high-performance unplugged 3D gaming, the Core Ultra 7 provides true day-long battery life, turning a gaming laptop into a viable everyday machine for school, work, and travel.
Price-to-Performance Analysis: Is Core Ultra 9 Worth It?
Building or purchasing a gaming system is an exercise in resource allocation. When shopping the configurations offered by brands like ASUS, Lenovo, Dell, and Razer, the jump from a Core Ultra 7 configuration to a Core Ultra 9 typically carries an OEM price premium ranging from $150 to $300.
The GPU Tier Rule: Upgrading Silicon vs Upgrading Graphics
The single most important rule in laptop gaming performance is that graphics silicon tiers and assigned Total Graphics Power (TGP) dictate more than 90% of your real-world framerate experience at native panel resolutions. Spending extra budget on high-tier CPU silicon paired with an entry-level or mid-range GPU is the single most common purchasing mistake we see in our testing lab.
If you have an extra $200 in your laptop procurement budget, upgrading from an RTX 4060 to an RTX 4070—or moving from an RTX 4070 to an RTX 4080—will transform your gaming performance, enabling higher ray tracing presets, superior frame generation capabilities, and wider memory bus bandwidth. Spending that exact same $200 to upgrade from an Ultra 7 to an Ultra 9 within the same GPU bracket will net you a measly 1 to 2 frames per second in modern AAA games.
Content Creation and Multi-Threaded Edge Cases
Is there any operational scenario where stepping up to the Core Ultra 9 185H makes financial and computational sense? Yes, but these are restricted to specialized professional workloads rather than gaming.
If you intend to use your gaming laptop as a mobile production workstation for sustained 4K timeline rendering in Adobe Premiere Pro, high-resolution rendering passes in Blender, large-scale multi-threaded code compilation via LLVM, or scientific batch simulations, the Ultra 9’s
Top Hardware Lab Tested Picks For This Guide

MSI Titan 18 HX Dragon Edition (RTX 5090)
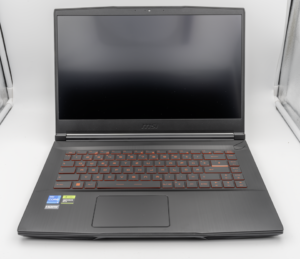
MSI Titan 18 HX A14V (Core i9-14900HX, RTX 4090)

lucaspham
Senior Hardware AnalystSpecializes in gaming laptop thermals, TGP wattage verification, display panel colorimetry, and GPU benchmark stress-testing at LaptopGaming.net.