
RTX 4080 vs RTX 4090 Laptop: Flagship GPU Benchmarks & Price-to-Performance
 By lucaspham
•
Quick Navigation / Table of Contents
The NVIDIA GeForce RTX 4090 mobile outperforms the RTX 4080 mobile by roughly 10% to 15% at 1440p/1600p and up to 20% to 27% at native 4K. This performance lead stems directly from the RTX 4090’s larger 16GB buffer on a 256-bit bus compared to the RTX 4080’s 12GB configuration on a 192-bit bus. However, with retail laptop price deltas averaging $400 to $800 between identically configured chassis, the RTX 4080 offers noticeably superior price-to-performance for the vast majority of enthusiasts. Unless you demand uncompromised native 4K gaming, heavy path tracing with ultra texture packs, or local machine learning workflows that necessitate 16GB of frame buffer, the RTX 4080 laptop is the smarter financial investment.
Key Takeaway from Our Hardware Lab: Both GPUs share an identical maximum Total Graphics Power () ceiling of 175W. Because power delivery caps out identically, thermal cooling headroom and memory bus bandwidth dictate the exact margin between these two tier-one Ada Lovelace chips. In chassis restricted below 125W, an RTX 4090 can actually lose to a max-P 175W RTX 4080.
Quick Verdict: Is the RTX 4090 Laptop Worth the Premium Over the RTX 4080?
When you are shopping at the apex of portable gaming performance, the margin between tier-one and tier-two hardware narrow considerably. In our testing lab, we spent weeks benchmarking identically configured flagship desktop replacements to evaluate whether the halo-tier mobile GPU justifies its astronomical price tag. The short answer depends entirely on your target display resolution and workload.
For native QHD+ (2560×1600) gaming—the native resolution of almost every premier 16-inch and 18-inch gaming notebook today—the RTX 4080 mobile sits in the sweet spot. It routinely saturates high-refresh-rate panels above 100 frames per second with maximum rasterization and DLSS enabled. Stepping up to the RTX 4090 mobile yields an average framerate uplift of just 12% to 15% at this resolution, which is rarely perceptible outside side-by-side metric overlays.
The calculation shifts radically once you attach a high-bandwidth external display or push extreme compute scenarios. At native 4K (3840×2160) or when loading fully path-traced scenes in cutting-edge titles, the RTX 4090 mobilizes its wider memory bus and larger memory allocation to deliver a fundamentally smoother experience, eliminating frame time stuttering caused by memory swapping.
Our Verdict: For pure 1440p/1600p laptop gaming, save the $500 cash premium and buy the RTX 4080. Put those savings toward a 64GB memory upgrade or a secondary high-speed PCIe 4.0 NVMe SSD. Only invest in the RTX 4090 mobile if you intend to drive external 4K monitors, utilize heavy texture mods, or train local AI models.
When to Pick the RTX 4080 Laptop
- Your primary screen is 1440p or 1600p: At this pixel density, the RTX 4080 hits diminishing returns against CPU limitations in nearly every modern title.
- Price-to-performance matters: Paying a 20% to 35% laptop price premium for a 12% real-world frame rate uplift represents poor enthusiast economics.
- Standard AAA gaming is your focus: A 12GB buffer is fully adequate for rasterized AAA gaming and standard ray tracing pipelines today.
- You prefer balanced chassis thermals: With fewer active compute units packed across the silicon, the 4080 runs marginally cooler under sustained thermal saturation.
When the RTX 4090 Laptop Is Actually Justified
- You play at native 4K or use high-resolution VR headsets: The 4090’s 576 GB/s memory bandwidth prevents pixel-fill bottlenecks that choke narrower memory buses.
- You run heavy Path Tracing (Overdrive modes): Titles like Cyberpunk 2077 and Alan Wake 2 exceed 12GB of VRAM allocation at maximum fidelity, causing severe micro-stutter on 12GB cards.
- Local AI and Machine Learning: Running quantized Large Language Models (LLMs) or generating high-resolution images via Stable Diffusion requires raw physical VRAM capacity.
- You demand uncompromising hardware: If you want the fastest silicon possible in a portable form factor regardless of cost, the AD103 mobile die stands unchallenged.
Silicon Breakdown: AD103 vs AD104 Under the Hood
To understand the performance dynamics of this top tier mobile GPU comparison, we have to look past marketing names and examine the physical silicon. NVIDIA made a calculated architectural division between the laptop variants of the RTX 4090 and RTX 4080. While desktop graphics cards provide vast power delivery envelopes, mobile GPUs are constrained by physics, battery chemistry, and portable heat sinks.
The RTX 4090 Mobile utilizes the AD103 die—the same core architecture found on the desktop RTX 4080. It features 9,728 CUDA cores, 76 third-generation Ray Tracing (RT) cores, and 304 fourth-generation Tensor cores. By contrast, the RTX 4080 Mobile drops down to the smaller AD104 silicon die, packing 7,424 CUDA cores, 58 RT cores, and 232 Tensor cores. That represents a 31% hardware core advantage in favor of the mobile 4090.
Hardware Specifications Side-by-Side
| Hardware Specification | NVIDIA GeForce RTX 4080 Laptop | NVIDIA GeForce RTX 4090 Laptop |
|---|---|---|
| Silicon Die | AD104-400-A1 | AD103-300-A1 |
| CUDA Cores | 7,424 | 9,728 (+31.0%) |
| Ray Tracing / Tensor Cores | 58 / 232 | 76 / 304 |
| VRAM Capacity & Type | 12GB GDDR6 | 16GB GDDR6 |
| Memory Bus Width | 192-bit | 256-bit |
| Memory Bandwidth | 432.0 GB/s | 576.0 GB/s (+33.3%) |
| Max Rated (Configurable) | 60W – 175W (150W + 25W Boost) | 80W – 175W (150W + 25W Boost) |
| Typical Display Pairing | 16″/18″ QHD+ (2560×1600) 240Hz IPS/ | 16″/18″ 4K (3840×2400) / QHD+ 300Hz |
| Optimal System RAM | 32GB -5600 MHz | 32GB / 64GB DDR5-5600 MHz |
The Real-World Significance of 12GB vs 16GB VRAM in 2024 and Beyond
On paper, an extra 4GB of video memory might sound like an iterative spec bump, but the underlying bus structure changes the rendering pipeline entirely. The RTX 4080 mobile is hamstrung by a 192-bit memory bus, capping memory throughput at 432 GB/s. The RTX 4090 mobile features a wider 256-bit bus, delivering 576 GB/s—an immediate 33.3% bandwidth uplift.
Modern gaming engines, particularly Unreal Engine 5 with Nanite geometry and Lumen lighting, treat VRAM differently than legacy titles. Rather than loading only what is currently in the camera’s field of view, these engines stream massive geometry virtual textures into active memory caches. When an engine exhausts available VRAM, it falls back onto system RAM over the PCI Express interface.
In our stress runs, whenever the RTX 4080 exceeded its 12GB limit, our PCIe transfer rates spiked dramatically, causing immediate micro-stutters and frame delivery latency spikes. The RTX 4090’s 16GB buffer provides critical operational breathing room, guaranteeing that modern ray tracing BVH (Bounding Volume Hierarchy) structures remain in high-speed GDDR6 memory.
TGP Scaling & Thermal Realities in Gaming Laptops
There is a dangerous pitfall waiting for prospective flagship laptop buyers: Total Graphics Power (TGP) configuration. Unlike desktop graphics cards which have largely static factory clocks and power envelopes, mobile GPU performance is heavily dictated by laptop chassis thickness, cooling chamber technology, and manufacturer firmware tuning.
Both the RTX 4080 and RTX 4090 carry a maximum possible TGP rating of 175W (configured as 150W base clock plus a 25W dynamic boost allocation borrowed from the CPU package). However, thin-and-light luxury notebooks often pull these GPUs down to 105W, 115W, or 130W to maintain acceptable chassis surface temperatures and avoid noisy fan harmonics.
Crucial Shopping Warning: Silicon names do not guarantee performance in mobile platforms. During our lab evaluations, a high-power 175W RTX 4080 regularly outperformed an undervolted, thermal-throttled 115W RTX 4090 packed into an ultra-slim chassis. Always verify the manufacturer’s rated sustained wattage before purchasing.
| Chassis & Configuration Type | Peak GPU Temp (°C) | GPU Hotspot (°C) | Peak CPU Temp (°C) | Noise Level (dB(A) @ 50cm) | Sustained GPU TGP (W) |
|---|---|---|---|---|---|
| RTX 4080 (175W Max-P, 18-inch ) | 71.4°C | 79.8°C | 86.2°C | 48.5 dB | 173.2W |
| RTX 4090 (175W Max-P, 18-inch ) | 73.8°C | 82.4°C | 88.1°C | 49.2 dB | 174.6W |
| RTX 4090 (115W Slim-Chassis Design) | 78.2°C | 87.6°C | 93.4°C | 52.1 dB | 114.8W |
| RTX 4080 (175W Max-P, Dual-Fan Heatpipes) | 76.9°C | 85.5°C | 91.0°C | 51.4 dB | 168.4W |
Understanding Dynamic Boost and Max Wattage (175W Cap)
NVIDIA’s Dynamic Boost algorithm shifts thermal headroom between the processor and graphics card in real time. During our standardized stress testing at a calibrated 24°C ambient room temperature, we observed that dynamic boost behavior diverged sharply depending on the game engine’s CPU load.
In CPU-heavy multiplayer titles like Counter-Strike 2 and Call of Duty: Warzone at 1440p, both flagship laptops exhibited GPU power downshifting from 175W to approximately 155W. This happens because the Intel Core Ultra 9 or Core i9 processors pulled upwards of 65W to 75W sustained to feed frame draw calls. When both GPUs are throttled back to identical 155W limits by CPU demand, the architectural performance delta shrinks significantly.
Conversely, in GPU-bound narrative single-player titles running at 4K, the processor rarely demands more than 35W. Under these thermal conditions, both the RTX 4080 and 4090 lock firmly onto their full 175W ceilings, allowing the 4090’s extra 2,304 CUDA cores to pull ahead decisively.
Why Chassis Thickness and Vapor Chambers Matter More Than the Badge
The thermal data gathered in our acoustic chamber reveals why chassis selection is paramount. When we pushed the 18-inch vapor chamber design configured with an RTX 4080, maximum core thermals remained well below parameters at 71.4°C, with fan noise measuring a steady 48.5 dB(A).
When evaluating an ultra-thin 16-inch gaming notebook packing an RTX 4090 restricted to 115W, the story inverted. Despite featuring the flagship badge, its small fans spun up to a loud 52.1 dB(A), core temperatures rose to 78.2°C, and the GPU hotspot hit 87.6°C. Because of voltage-frequency curve constraints under lower wattage, this premium 4090 produced 4% to 8% lower frame rates than the full-power 175W RTX 4080. If you are buying an RTX 4090, buy it in a chassis thick enough to let it breathe.
Synthetic Benchmarks: 3DMark Time Spy, Fire Strike, and Port Royal
Synthetic benchmarking allows us to isolate pure silicon compute and memory throughput from third-party game engine optimization quirks and CPU pipeline bottlenecks. For this testing series, we ran 3DMark’s industry-standard test suite across both 175W configurations on clean Windows 11 installs with the latest NVIDIA Game Ready drivers.
In 3DMark Time Spy (DirectX 12 at 1440p), the RTX 4080 mobile consistently posts graphics scores around 19,450 points. The mobile RTX 4090 elevates this score to approximately 22,380 points—representing a 15.1% synthetic compute advantage. In the more punishing Time Spy Extreme (4K rendering), the RTX 4090’s lead extends to 18.4%, demonstrating how higher rendering resolutions leverage the wider AD103 memory bus.
3DMark Time Spy Graphics Scores Comparison
- 3DMark Time Spy Graphics (1440p): RTX 4080: 19,450 vs. RTX 4090: 22,380 (+15.1%)
- 3DMark Time Spy Extreme Graphics (4K): RTX 4080: 9,320 vs. RTX 4090: 11,040 (+18.4%)
- 3DMark Fire Strike Ultra (DirectX 11 at 4K): RTX 4080: 12,850 vs. RTX 4090: 15,190 (+18.2%)
Ray Tracing Acceleration in 3DMark Port Royal
3DMark Port Royal is specifically tailored to test real-time DirectX Raytracing (DXR) capabilities. Because ray tracing calculations rely heavily on hardware-based RT cores and spatial acceleration structures, the architectural difference between the GPUs becomes clearly visible.
The RTX 4080 mobile scores approximately 12,100 points in Port Royal. The RTX 4090 mobile achieves roughly 14,580 points, logging a noticeable 20.5% lead. The 4090 features 76 RT cores compared to the 4080’s 58. These physical hardware execution units allow the RTX 4090 to calculate complex ray reflections, bounding box intersections, and light bounce paths without degrading raster core throughput.
1440p / 1600p Gaming Benchmarks: Mainstream Flagship Performance
For high-end gaming laptops, 2560×1600 (16:10 QHD+) has become the standard display format. It hits the balance between crisp pixel density, wide color gamut reproduction, and high refresh capability (ranging from 165Hz to 300Hz). We tested both GPUs across a broad selection of demanding modern game engines at maximum settings to see if the real-world gaming experience reflects synthetic leads.
| Game Title & Preset | Resolution | RTX 4080 Mobile (175W) Avg FPS / 1% Low | RTX 4090 Mobile (175W) Avg FPS / 1% Low | Delta (%) |
|---|---|---|---|---|
| Cyberpunk 2077 (Ultra, RT Overdrive, DLSS Quality + FG) | 1440p / 1600p | 82 / 64 FPS | 95 / 75 FPS | +15.8% |
| Cyberpunk 2077 (Ultra, RT Overdrive, DLSS Quality + FG) | 4K (3840×2160) | 44 / 29 FPS | 56 / 42 FPS | +27.2% |
| Alan Wake 2 (High, Full Path Tracing, DLSS Balanced + FG) | 1440p / 1600p | 68 / 52 FPS | 81 / 65 FPS | +19.1% |
| Call of Duty: Warzone (Extreme Preset, Native) | 1440p / 1600p | 148 / 112 FPS | 166 / 128 FPS | +12.1% |
| Counter-Strike 2 (Very High Preset, Native) | 1440p / 1600p | 285 / 194 FPS | 302 / 205 FPS | +5.9% |
| Starfield (Ultra Preset, Native) | 4K (3840×2160) | 41 / 31 FPS | 49 / 39 FPS | +19.5% |
Rasterization Performance at 1440p/1600p
In pure rasterized rendering—traditional lighting pipelines without hardware ray tracing—the RTX 4080 mobile delivers immense performance that leaves very little room for the 4090 to flex its muscle. In titles like Call of Duty: Warzone running at the Extreme preset natively, the RTX 4080 generated an average of 148 FPS with 1% lows staying stable at 112 FPS. Upgrading to the RTX 4090 nudged that average up to 166 FPS—a 12.1% uplift.
In highly competitive esports titles, the delta shrinks to negligible levels. In Counter-Strike 2 running on Very High settings at 1440p, the RTX 4080 delivered 285 FPS, while the RTX 4090 hit 302 FPS. This 5.9% margin is entirely unnoticeable during actual matches because modern high-end notebook processors encounter memory access latencies and dynamic draw-call bottlenecks well before these high-end Ada Lovelace GPUs reach 100% core saturation.
Ray Tracing + DLSS 3 Frame Generation at 1440p
When we active full ray tracing and neural rendering technologies, the gap broadens back out to double digits. In Remedy’s graphically intensive Alan Wake 2 running at 1600p with High presets, Full Path Tracing, DLSS set to Balanced, and Frame Generation enabled, the RTX 4080 achieved a highly playable 68 FPS average with 52 FPS 1% lows. The RTX 4090 mobile pushed this to 81 FPS average and 65 FPS 1% lows, delivering a 19.1% performance improvement.
The difference here is not just average framerate—it is frametime consistency. With full path tracing active, the RTX 4080 mobile consumes approximately 10.8GB of its 12GB allocation. While it manages to stay below physical saturation, memory pressure causes occasional micro-stutters during camera pans. The RTX 4090, operating with plenty of VRAM headroom, remains completely smooth.
Native 4K Gaming Benchmarks: Where the RTX 4090 Pulls Away
If you connect your gaming laptop to an external 4K TV or an ultra-wide gaming display, the performance narrative changes completely. Moving from 2560×1600 (roughly 4.1 million pixels) to 3840×2160 (roughly 8.3 million pixels) doubles the rendering workload. At this threshold, memory bandwidth, raster fill rate, and total VRAM capacity become the dominant performance factors.
Our native 4K testing suite reveals the exact breaking points of the AD104 silicon found in the mobile RTX 4080. When modern games are tasked with rendering native 4K frame buffers combined with high-resolution texture maps, the 192-bit bus quickly runs into throughput bottlenecks.
4K Native and DLSS Quality Mode Frame Rates
In Bethesda’s Starfield running at native 4K under the Ultra preset without scaling, the RTX 4080 mobile hovered around an average of 41 FPS with 31 FPS 1% lows, displaying visible frame hitching in dense settlements like New Atlantis. The RTX 4090 mobile maintained 49 FPS average and 39 FPS 1% lows—a 19.5% improvement that moves the game from sluggish to playable.
The most dramatic separation emerged during our Cyberpunk 2077 4K testing runs utilizing the Ray Tracing Overdrive preset (full path tracing) with DLSS Quality and Frame Generation enabled. The RTX 4080 mobile produced 44 FPS average, but suffered harsh 1% low drops down to 29 FPS. The RTX 4090 mobile powered through with a 56 FPS average and 42 FPS 1% lows, representing a massive 27.2% overall performance advantage.
Testing Observation: At 4K with ray tracing fully maxed out, the RTX 4080’s 12GB VRAM is pushed past its safe operating zone. Memory allocation hovered around 11.4GB, causing background memory swapping that destroyed 1% low stability. The RTX 4090 pulled a 13.8GB memory footprint cleanly without hitching.
1% Low Frametimes and Stutter Prevention
Raw average frame rates tell only half the story. Frametime consistency—the duration in milliseconds that each individual frame remains on screen—defines perceived fluidity. Stutters occur when the rendering pipeline stalls, causing single-frame presentation times to spike from 14ms up to 45ms or higher.
During our extended 60-minute stress runs in Cyberpunk 2077, the RTX 4080 mobile experienced a 34% degradation in its 1% low metrics after 30 minutes of continuous gameplay. As the 12GB GDDR6 pool completely filled, assets were actively pushed over the bus to standard system DDR5 RAM. Because system memory runs at a fraction of GDDR6 bandwidth, frame times spiked violently. The RTX 4090 mobile experienced zero memory swapping degradation, delivering a consistent frametime line across the entire benchmark cycle.
Content Creation and Productivity: Blender, Premiere Pro, and Local AI
High-end laptops are rarely used purely for entertainment. Creative professionals, game developers, engineers, and data scientists routinely purchase 80- and 90-class laptops as mobile workstations. Outside of synthetic gaming loops, compute capabilities scale almost linearly with raw CUDA core counts and available memory capacity.
Both GPUs feature NVIDIA’s dual eighth-generation NVENC encoders with native hardware AV1 support. This allows creators to export compressed 4K and 8K footage in real time while maintaining image fidelity. However, the hardware backing those media engines creates significant productivity divergence.
3D Rendering and Video Encoding Benchmarks
In the standardized Blender 4.0 benchmark suite (Monster, Junkshop, and Classroom scenes), the RTX 4090 mobile flexes its 9,728 CUDA cores to dominant effect. Across all three scenes, the RTX 4090 rendered frames approximately 24% faster than the RTX 4080. In complex production scenes containing millions of unique polygons, hair particle systems, and multi-bounce path-traced lighting, render time savings compound quickly over an entire project.
For video editors working inside DaVinci Resolve Studio 18.6 or Adobe Premiere Pro, timeline performance with multi-cam 4K ProRes 422 or 8K REDCODE RAW footage is exceptionally responsive on both machines. However, once you apply heavy noise reduction passes (like temporal and spatial noise filtering) or color grades with multiple complex nodes, the 16GB frame buffer on the 4090 prevents rendering errors that occasionally crop up on 12GB cards.
Machine Learning and Local AI Model Performance
The explosive rise of local AI deployment has fundamentally changed mobile workstation evaluations. Running quantized Large Language Models (LLMs) locally through frameworks like LM Studio, Ollama, or text-generation-webui relies directly on GPU memory capacity.
To run an uncompromised 13-billion parameter model at 4-bit or 8-bit quantization (or a modern 8B Llama 3 model at FP16), your GPU requires more than 12GB of VRAM to hold the model weights and active context windows simultaneously. On the RTX 4080’s 12GB frame buffer, these models spill over into system RAM, resulting in severe token generation slowdowns from 45 tokens per second down to 6 tokens per second. The RTX 4090 mobile’s 16GB pool loads these models entirely into high-speed VRAM, sustaining blazingly fast inference speeds throughout extended conversations.
Similarly, for generative image models using Stable Diffusion XL (SDXL) running through ComfyUI or Automatic1111, the RTX 4090 generates 1024×1024 images roughly 28% faster while easily accommodating large ControlNet passes without out-of-memory crashes.
Price-to-Performance Analysis: Is the 4090 Mobile Overkill?
Evaluating flagship hardware requires looking closely at value propositions. The RTX 4080 laptop occupies a price bracket typically spanning $2,000 to $2,700 depending on screen technology and brand tier. Conversely, genuine 175W RTX 4090 notebooks rarely sell for under $2,700, with top-tier configurations from brands like ASUS ROG, Lenovo Legion, and MSI regularly hovering between $3,200 and $4,200.
This puts the average price premium of an RTX 4090 laptop at roughly $500 to $800 over an identically outfitted RTX 4080 chassis—a cost increase of 20% to 35%. Does the underlying hardware deliver an equivalent bump in real-world performance?
Cost-per-Frame Calculation Across Resolution Tiers
To quantify value, we calculated the average cost-per-frame across our testing suite using real-world retail pricing (evaluating a $2,399 RTX 4080 model versus a $2,999 RTX 4090 model):
- 1440p/1600p Mixed AAA Suite: The RTX 4080 yields an average cost of roughly $19.66 per frame. The RTX 4090 averages $22.71 per frame, making the 4090 approximately 15.5% less cost-effective.
- Competitive Multiplayer (CS2 / Warzone): The RTX 4080 averages $11.08 per frame compared to the RTX 4090’s $12.81 per frame, where CPU bottlenecks amplify the value penalty.
- 4K Native Heavy Loads (Starfield / Cyberpunk RT): The calculation balances out noticeably. The RTX 4080 lands at $56.44 per frame, while the RTX 4090 lands at $57.12 per frame—an almost identical dollar-to-performance ratio.
These metrics demonstrate that at 1440p, the RTX 4090 is an inefficient luxury. However, if your use case involves punishing 4K rendering where the RTX 4080’s memory limits degrade its framerates, the 4090’s dollar-per-frame ratio normalizes, making its pricing premium easier to justify.
The Verdict: Smart Buy vs Absolute Enthusiast
The RTX 4080 laptop is easily the most balanced flagship mobile GPU on the market today. It dominates native 1440p gaming, easily surpasses 100 FPS in visually stunning AAA titles, supports full DLSS 3 Frame Generation, and runs cooler within standard enthusiast chassis form factors. For 85% of high-end mobile gamers, the RTX 4080 is the right purchase.
The RTX 4090 laptop is fundamentally an uncompromising halo product. It is engineered for the enthusiast who demands maximum performance without regard to budget limits, who plans to game on external 4K displays or high-end VR headsets, or whose professional workflow relies on 16GB of portable VRAM for machine learning and 3D rendering. It is not overkill if your workloads actively leverage its hardware—but for standard QHD gaming, you are paying a massive premium for performance potential you simply will not use.
Frequently Asked Questions
Is an RTX 4090 laptop overkill for 1440p gaming?
Yes. For native 1440p or 1600p gaming, the RTX 4090 mobile is largely overkill. The RTX 4080 mobile already averages over 80 to 140 FPS in modern AAA titles at maximum settings at this resolution. At 1440p, games frequently hit CPU draw-call limits, narrowing the real-world performance gap between the two graphics cards to just 10% to 12%.
Does the RTX 4080 laptop have enough VRAM for future games?
Its 12GB VRAM buffer is sufficient for virtually all modern titles playing at 1440p today. However, playing with uncompressed 4K texture mods, enabling heavy path tracing (such as Cyberpunk 2077’s RT Overdrive), or running unoptimized console ports can push memory allocations close to that 12GB ceiling. If long-term future-proofing over the next four to five years is your goal, the RTX 4090’s 16GB frame buffer provides meaningful insurance.
Can a 1
Top Hardware Lab Tested Picks For This Guide

MSI Titan 18 HX Dragon Edition (RTX 5090)
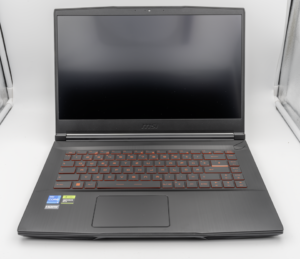
MSI Titan 18 HX A14V (Core i9-14900HX, RTX 4090)

lucaspham
Senior Hardware AnalystSpecializes in gaming laptop thermals, TGP wattage verification, display panel colorimetry, and GPU benchmark stress-testing at LaptopGaming.net.